

Reducing warranty costs of Valtra's tractors with Machine Learning
Fortum leverages thermal imaging and advanced analytics for leak detection
With a thermal imaging and AI analytics-based solution, Fortum is now able to find double the amount of confirmed leaks in an early stage compared to the previous manual approach in their district heating network in Espoo. The new solution provides the network maintenance team a heatmap with likely leaks, who then validates the findings and fixes any found leaks. In addition, the team can view the heatmap of the whole city network and for example identify poorly insulated network stretches that should be prioritized in yearly maintenance plans.
"Advian's leak analytics has proven very useful and has enabled us to find, fix and prevent leaks in our district heating network. Sustainability and keeping our network well maintained are priorities for us." - Teemu Mäki, DH Operations Manager at Fortum.
Fortum is a Finnish clean energy and sustainable solutions provider aiming for complete carbon neutrality by 2050. As a part of its sustainability goals, Fortum is aiming for carbon-neutral district heating in Espoo, Finland, already during this decade. Advian has worked together with Fortum towards the carbon target by controlling and reducing water leakages in its district heating network using Artificial Intelligence and thermal imaging.
In Espoo, Fortum has approximately 900 kilometers of underground district heating network, which is prone to small and big leaks. Leaks are difficult to detect and they often go unnoticed, especially if the leaks are small and come from cold-water pipes. However, all leaks are wasteful, expensive, and preventing Fortum from achieving its sustainability target.
AI and thermal imaging for precise leak detection
The goal of Fortum’s and Advian’s collaboration was to use Artificial Intelligence to process and analyze collected thermal camera data to find more leaks earlier and more precisely.
The project entailed around 16 000 thermal images captured by our partner Gridjet with a helicopter that had flown over the district heating network. Each image was used to piece together an orthomosaic map and the final result was a heatmap of Espoo. Advian’s Data Scientist Vincent Markiet, a key member of the project team, talks more about how exactly:
“An orthomosaic is a collection of individual aerial images stitched together that is geometrically correct. Stitching 16 000 images into one large orthomosaic is a complex task. During every helicopter flight, image distortion happens because of the fast movements. Each individual image has its own orientation in relation to the ground. During image processing, we remove the angular perspective view, lens distortion and camera angle to create an image that is viewed straight down. For example, the pixels of a building facade, visible in a helicopter image, will be squeezed to a minimum. The image will now be more geometrically accurate and can be used for distance and other spatial calculations," says Vincent.
Artificial Intelligence, Computer Vision and advanced analytics were used to locate warm and cold spots on the heatmap that represent potential leaks in the network. However, not all warm spots on the map are leaks, since there are other naturally occurring warm features in the city, such as warm cars or ventilation exhausts. With the help of Gridjet's leak reference dataset, Advian's team came up with a solution to identify true leaks:
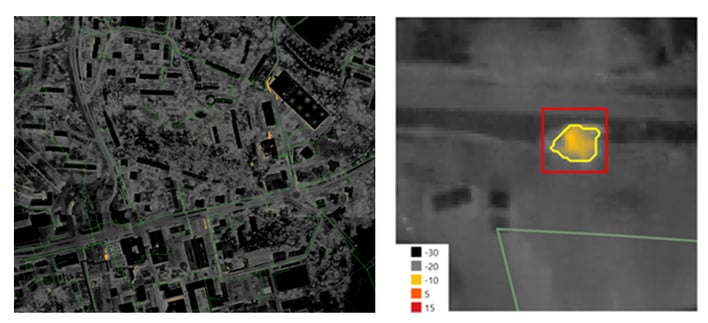
“We first used an adaptive gradient thresholding algorithm on the thermal orthomosaic to identify potential heat leakage pixels using temperature values as input. This resulted in tens of thousands of pixel clusters, we call heat blobs. We then collected thousands of heat blobs as samples and clustered them in five classes. 1) potential leak, 2) ditches, 3) chimneys, 4) cars and 5) other, for all the remainder samples. We then trained a convolutional neural network (CNN) to calculate, for each heat blob, a heat leakage probability value. A spatial and statistical filter was applied to create a manageable blob dataset for validation. We then validated the classified heat leaks with in-house and external energy network experts,” Vincent explains.
"Working on this district heat leakage project has been very rewarding. Thermal data is an upcoming data source that has the potential to introduce new end users to the power of geospatial applications. The best part of this project was to see Fortum confirm our results after field validation. What started out as a simple idea to solve a problem, turned into a successful solution using thermal data and innovative AI algorithms," Vincent concludes.
💡 Did you know that thermal imaging can be used in many other application, for example in quantifying building heat loss because of poor insulation.
Advian’s team’s solution and analytics are able to locate more leaks more accurately and reduce false predictions of leakages. Earlier, each thermal image was manually analysed, and some leaks were never detected. Now, Fortum is able to find double the number of real leaks, decrease manual work, and optimize the district heating system saving hundreds of thousands annually. Additionally, the new solution is faster and more accurate – helping Fortum provide carbon-neutral district heating to their customers already in the 2020s.

