GRIDLYTICS® turns data into answers, not averages. Real-time visibility into what is happening in your network now and intelligence about where it is heading.
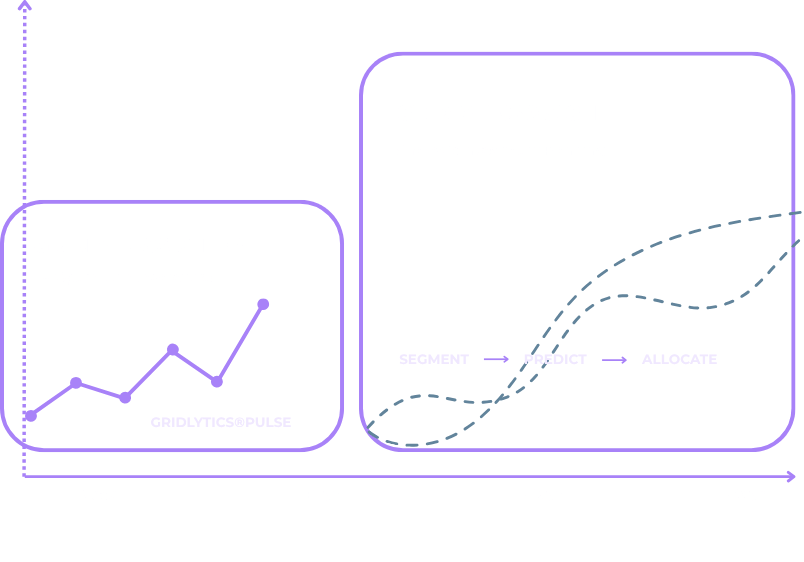
GRIDLYTICS® Steer turns grid and metering data into actionable decisions for maintenance, quality management, and operations.
It provides clear situational awareness of the low-voltage network, supports resource prioritization, and ensures that decisions are always data-driven.
.png?width=960&height=540&name=Advian%20Gridlytics%20Sight%20(2).png)
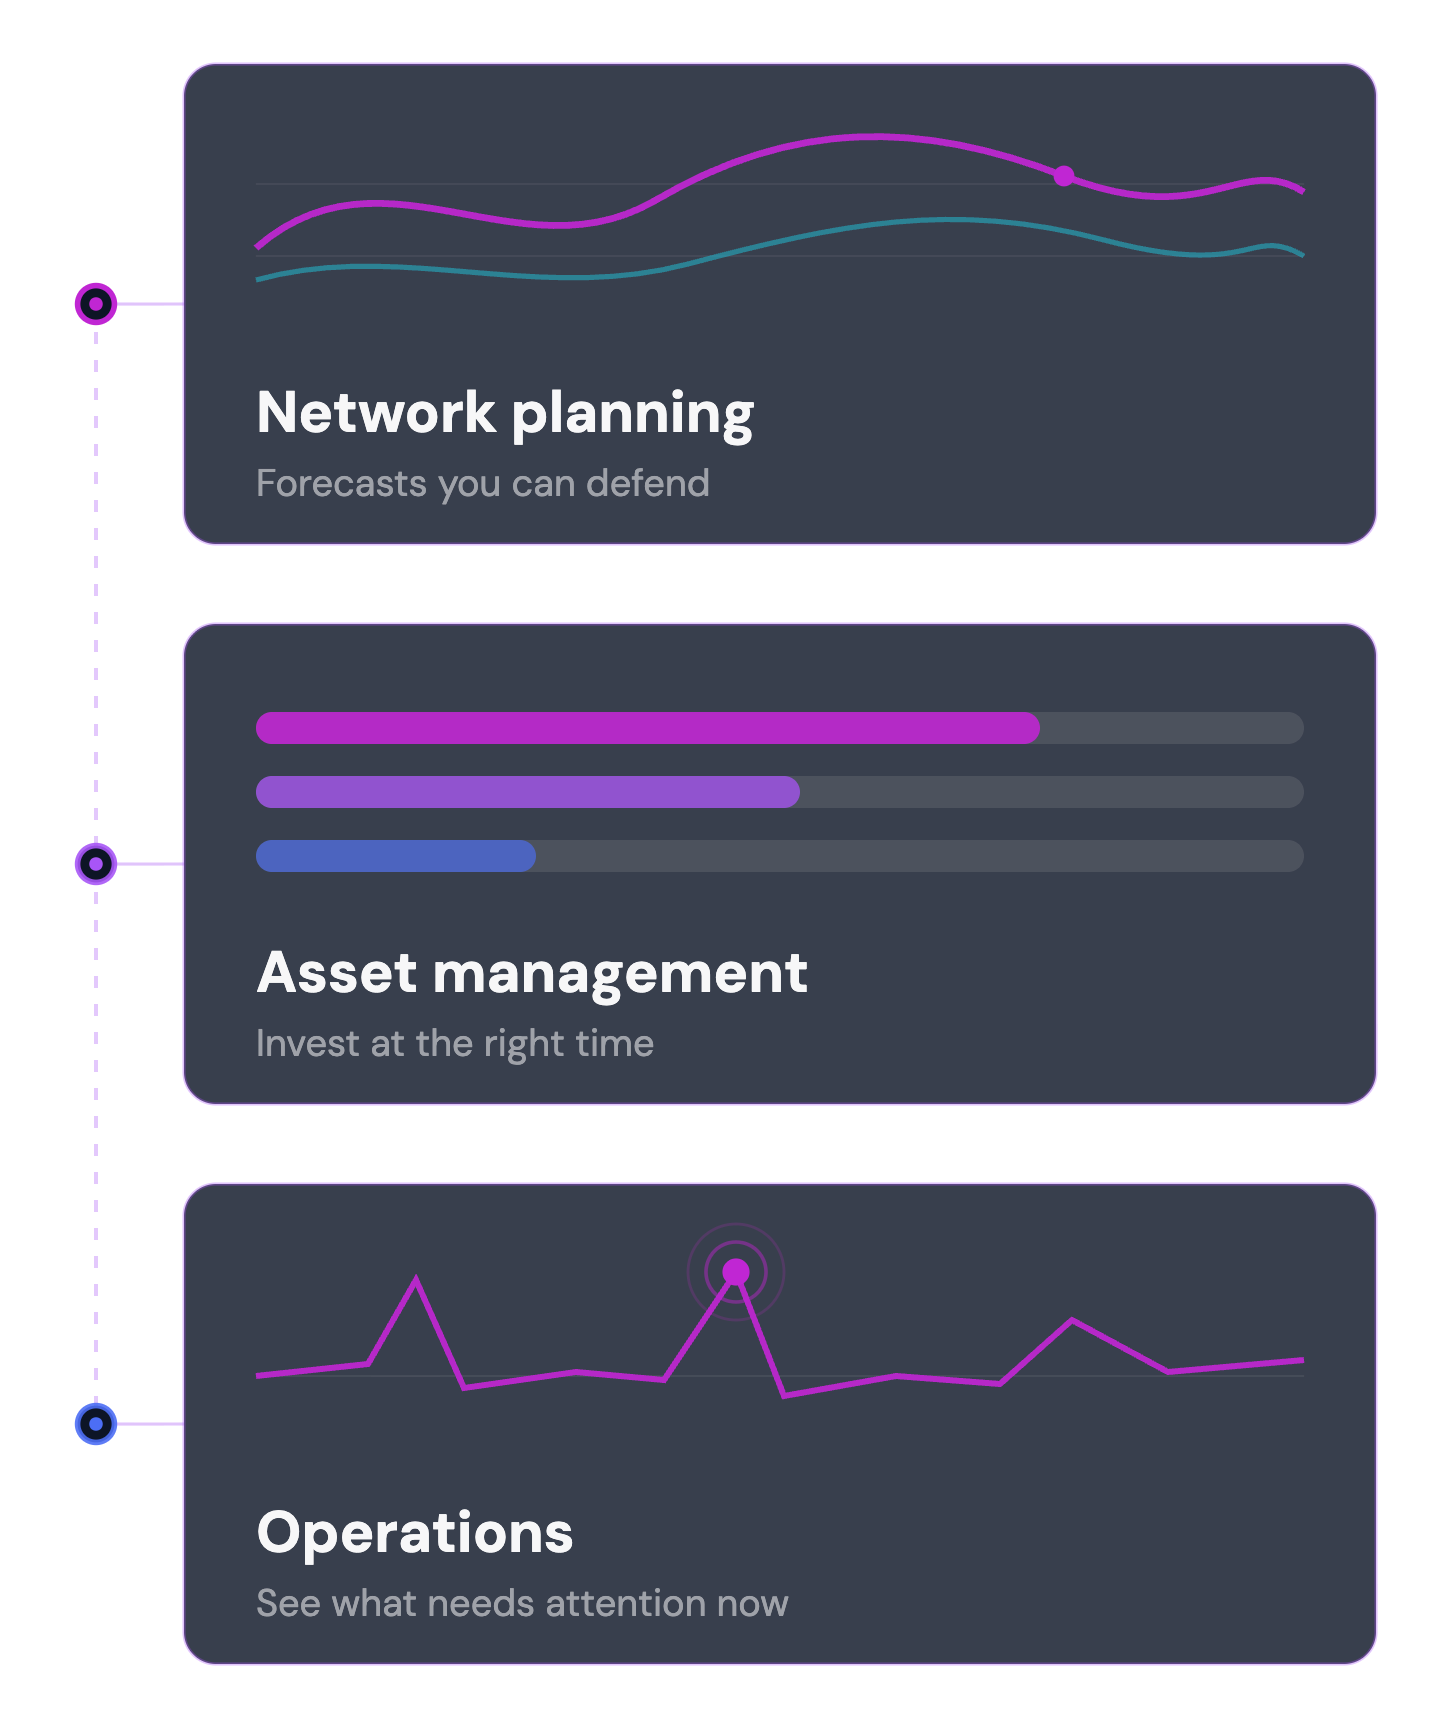
Gridlytics® Sight helps network planners forecast where and when grid reinforcement is needed. Run scenarios in minutes, justify investments with real data, and integrate without changing your existing systems.


Tell us about your network and the decisions you are trying to make better. Send us a message with the form or book a meeting with our experts:

Marko Juntunen
Senior Sales Executive, Energy and Utilities
marko.juntunen@advian.fi